Why do modern businesses need dashboard development services? To enhance real-time data analysis efficiency
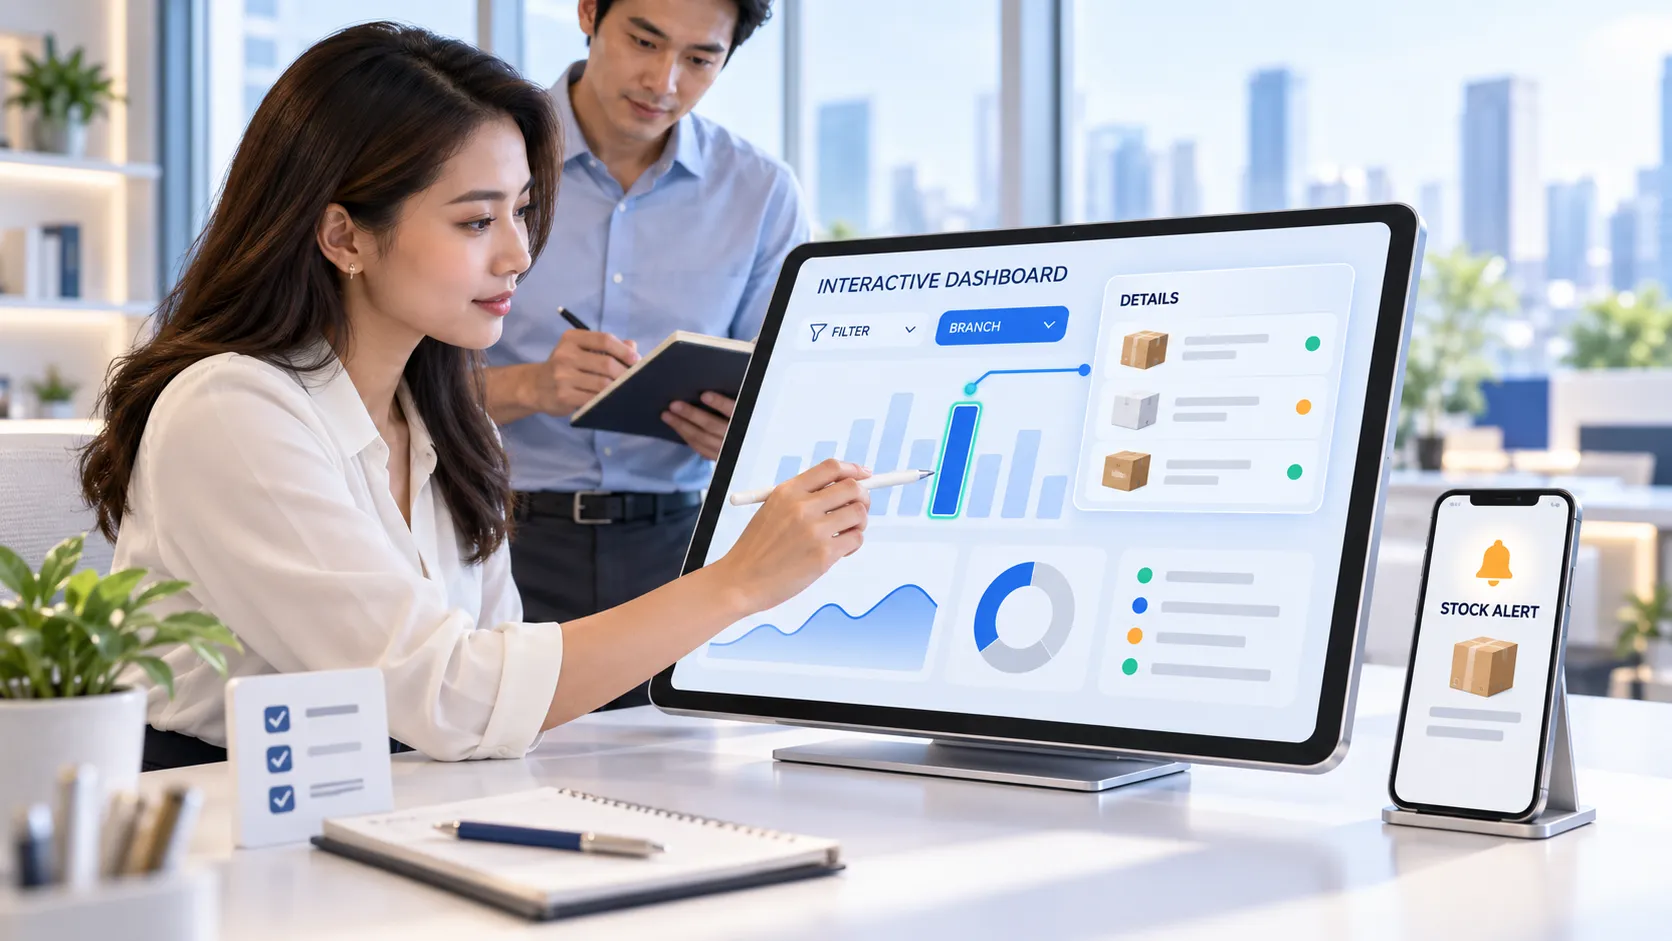
In an era where data has become a highly valuable resource, businesses that can quickly analyze and make decisions using data have a clear competitive advantage. However, many organizations face the problem of data being scattered across multiple systems such as ERP, CRM, POS, accounting systems , websites , social media , and Excel files . This makes data collection for report generation time-consuming and prone to errors.
For this reason Dashboard development services Therefore, it has become an important tool that helps gather information from all sources and display it on a single screen ( Single Source of Truth), along with real-time data updates. Real-time It helps executives and teams track KPIs , analyze trends, and make more accurate business decisions. Whether it's small businesses ( SMEs) , medium-sized businesses, or large organizations, they are all starting to pay attention to... Dashboard development services To improve data management, reduce report preparation time, and enhance competitiveness in the era of Digital Transformation.
This article will introduce you to... Dashboard development services This article discusses what data security is, its benefits, key features, and how to choose the right service provider for your organization, ensuring you make a worthwhile investment in data and drive long-term business results.
What is a dashboard ?
A dashboard is a screen that displays data collected from multiple systems in an easy-to-understand format, such as:
- Charts
- Tables
- KPI Scorecard
- Gauge
- Heatmap
- Trend Analysis
- Interactive Report
Dashboards transform vast amounts of raw data into actionable insights that can be used for immediate decision-making, eliminating the need to spend time gathering data from multiple files or systems. Furthermore, modern dashboards can automatically connect data, allowing users to see the latest information. Real-time It helps reduce the time required for manual report generation and minimizes errors from data copying.
Why are dashboards important for businesses in 2026?
Today, business competition is measured not only by the quality of products and services, but also by the "speed of decision-making." Organizations that can access the right information at the right time will be able to respond better to market changes.
For example,
- Executives can view sales figures for all branches instantly.
- The marketing department can track campaign results in real-time.
- The warehouse department can check the remaining stock immediately.
- The sales team can accurately track the pipeline and forecast .
- The finance department can analyze revenue, expenses, and cash flow from a single screen.
This is why many organizations choose to invest in... Dashboard development services To create a data analytics system that meets the needs of businesses in the digital age.
What is dashboard development service ?
Dashboard development services This service involves designing and developing systems to collect, analyze, and display data from multiple sources in an easily understandable format. The interface and key performance indicators ( KPIs) can be customized to suit the specific needs of each organization. The service provider will start by analyzing business needs, designing data structures, connecting databases and various systems, and developing functional dashboards that can be used on computers, tablets, and smartphones. in addition Dashboard development services It can also connect to internal and external organizational systems, such as:
- ERP
- CRM
- HRM
- POS
- Accounting Software
- Google Analytics
- Google Ads
- Facebook Ads
- LINE OA
- API from an external system.
- Cloud Database
- SQL Database
This allows organizations to manage all data from a central location, reducing redundancy and increasing the accuracy of data for decision-making.
What types of businesses are suitable for dashboard development services?
In fact, Dashboard development services It's not limited to large organizations but can be applied to almost every industry, including:
Retail business
- Track daily sales.
- Analyze best-selling products.
- Compare sales figures for each branch.
- Check product stock.
E-commerce business
- Analyze Conversion Rate
- Track your order
- Check sales figures from the Marketplace.
- Analyze customer behavior.
industrial plants
- Monitor production performance.
- Analyze Downtime
- Check product quality.
- Control production costs.
Service business
- Track service performance.
- Analyze customer satisfaction.
- Check the SLA.
- Analyze the team's productivity .
Hospitals and clinics
- Number of service recipients
- Waiting period
- Resource management
- Revenue of each department
Educational Institutions
- Track academic performance.
- Analyze student data.
- Executive Dashboard
- Analyze the performance of each faculty.
Thanks to its design flexibility, Dashboard development services It can be effectively adapted to align with the goals and indicators of each organization.
How does a dashboard differ from a report ?
Reports are typically static , generated at regular intervals such as daily, weekly, or monthly, while dashboards are interactive data visualizations. Users can filter data, delve into details, and track real-time metrics .
Dashboard system connect to other systems ?
can Dashboard development services It can connect to ERP, CRM, HRM, POS systems, accounting software , warehouse systems, as well as online marketing platforms and databases via API or Database Connector , allowing data from multiple sources to be integrated onto a single screen.
Do small businesses need a dashboard ?
Essential for businesses with ongoing monitoring of sales, customer, financial, or marketing data, dashboards provide business owners with a quick overview of performance, reduce report preparation time, and aid in effective growth planning.
Dashboard development services that help businesses achieve sustainable growth.
Having a large amount of data doesn't always mean a business can make good decisions if that data isn't organized, analyzed, and presented in an easily understandable format. Dashboard development services Therefore, it plays a crucial role in transforming raw data into insightful business information that can be used for effective planning and decision-making.
1. Analyzing data in real-time allows for faster decision-making. In the past, executives had to wait for end-of-day, weekly, or monthly reports to know the results of their operations. However, today, businesses face ever-changing competition, making real-time access to information crucial. When used Dashboard development services Information from all departments is continuously updated, allowing for immediate monitoring of the situation, such as:
- Hourly sales
- Number of orders received.
- Inventory
- Results of the marketing campaign.
- Number of new customers
- Closing rate
This allows management to address problems and adjust strategies in a timely manner, reducing the risk of revenue loss from delayed decision-making.
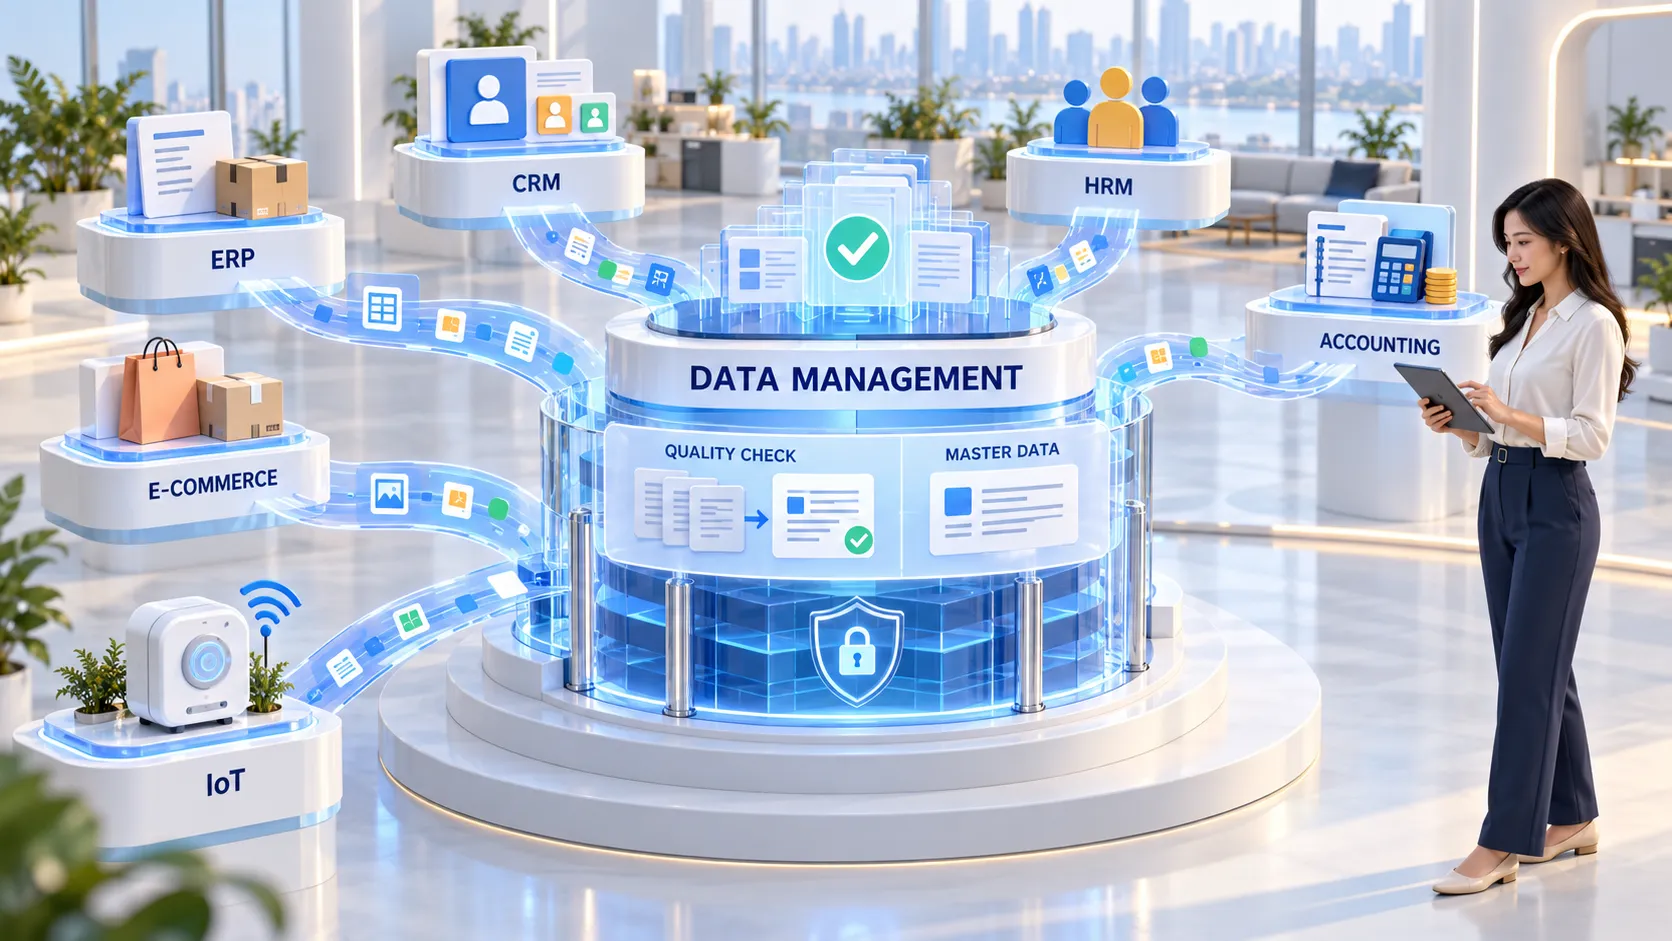
2. Combine data from multiple systems onto a single screen. Many organizations use various types of systems in their business operations, such as:
- ERP
- CRM
- HRM
- Accounting system
- POS
- Website
- Google Analytics
- Facebook Ads
- Google Ads
- LINE OA
Opening each system individually to view the data would be very time-consuming and could lead to inaccuracies in the analysis. Dashboard development services It helps to collect data from all systems via API or databases, allowing all parties to view information from a centralized dashboard in one place. This reduces redundancy in work and ensures everyone has access to the same data ( Single Source of Truth).
3. Reduce the time spent preparing reports. Many organizations still use Excel to create reports, which requires time to collect data, copy, verify, and create new graphs each time. When switching to... Dashboard development services The system will automatically generate a report, displaying the results in an easy-to-understand format, such as:
- Bar Chart
- Line Chart
- Pie Chart
- KPI Card
- Heatmap
- Pivot Dashboard
- Trend Analysis
This allows the team to focus their time on data analysis and strategy development, instead of wasting time on repetitive tasks.
4. Accurately track KPIs . KPIs (Key Performance Indicators) are important metrics that reflect an organization's performance. Without a good tracking system, performance evaluations may be delayed or incomplete. Dashboard development services KPI dashboards can be designed to suit each department, for example:
Sales Department
- Total sales
- Conversion Rate
- Sales Pipeline
- Revenue Forecast
Marketing Department
- Cost per Lead
- ROAS
- CTR
- Engagement Rate
Management
- Revenue Growth
- Profit Margin
- Cash Flow
- Customer Retention
Warehouse Department
- Inventory Turnover
- Stock Level
- Safety Stock
- Order Fulfillment
Seeing real -time KPIs allows all parties to be aware of the current situation and adjust operational plans in a timely manner.
5. Improve the accuracy of data analysis. Data collected manually is prone to errors due to copying, data entry, or merging files from multiple sources. Usage Dashboard development services This helps reduce such risks because the system can retrieve data directly from the source database, ensuring the data is accurate and up-to-date. Furthermore, business rules can be defined to standardize data presentation across the organization, building confidence in the data's use for decision-making.
Key features that a dashboard system should have.
Selection Dashboard development services When considering screen aesthetics, features that enhance practical usability should also be taken into account.
1. Real-time Data Dashboard The system should automatically update information at specified intervals or in real-time so that users always have access to the latest information.
Suitable for
- Sales
- Production
- warehouse
- marketing
- Customer service
2. Interactive Dashboard Users should be able to interact with the information, for example:
- Filter
- Search
- Drill Down
- Drill Through
- Compare Period
- Dynamic Chart
It allows for more flexible and in-depth data analysis.
3. Mobile Dashboard Today's executives don't work in front of a computer all the time, so the dashboard should be accessible via...
- Smartphone
- Tablet
- Notebook
It supports responsive design , allowing you to access information anytime, anywhere.
4. Notification & Alert Another important feature of Dashboard development services It's an automatic notification system that alerts you when predefined events occur, such as:
- Sales were below target.
- Stock is almost depleted.
- KPIs are below standard.
- Spending exceeds the budget.
- The system has malfunctioned.
Proactive notifications enable teams to take corrective action before problems impact the business.
5. Role-based Access Control Certain types of information should not be accessible to everyone. A good dashboard should therefore support role -based access control.
For example,
- Executives have access to overall organizational data.
- The sales manager only sees sales team information.
- The accounting department saw the financial information.
- The warehouse department saw the stock information.
This feature enhances data security and reduces the risk of unauthorized access to irrelevant information.
6. Supports connection with internal and external systems. One of the strengths of Dashboard development services It is the ability to link data from multiple sources to create a comprehensive data view.
Examples of systems that can be connected include:
- ERP
- CRM
- HRM
- Payroll
- POS
- Accounting Software
- SQL Server
- MySQL
- Oracle Database
- Microsoft SQL
- Google Analytics 4 (GA4)
- Google Ads
- Meta Ads
- TikTok Ads
- LINE Messaging API
- REST API
- Cloud Database
When all the data is consolidated into a single dashboard, executives can more easily analyze the relationships between data segments, such as comparing advertising budgets to sales or analyzing the impact of inventory on revenue.
7. Easy-to-understand data visualization. Complex data becomes more valuable when presented in an easily understandable format. A good dashboard should therefore design data visualizations that are suitable for the type of data, such as:
- Bar chart for comparing results.
- A line graph for showing trends.
- Pie chart for data proportions.
- Heatmap for showing data density.
- KPI Card for Key Figures
- Geographic map for spatial information.
Choosing the right visualization tools can help users understand data quickly and reduce the complexity of analysis.
The application of dashboard development services in various industries.
Although many people view dashboards as simply tools for displaying reports, in reality... Dashboard development services It can be flexibly designed to align with the workflow and business goals of each organization, allowing all departments to use data to improve operational efficiency and reduce costs in a tangible way.
1. Dashboard for Retail Businesses Retail businesses manage vast amounts of data, including sales figures, inventory, promotions, and customer information. Relying solely on manual data collection can lead to delayed decision-making and missed business opportunities.
Examples of popular dashboards include:
- Daily, monthly, and yearly sales figures.
- Sales by branch.
- Best-selling products
- moving products
- Stock remaining
- Gross Profit
- Compare sales figures for each area.
- Results of the promotion.
When used Dashboard development services Managers can monitor the situation of all branches from a single screen, enabling more accurate marketing planning and inventory management.
2. Dashboard for E-commerce Businesses Online businesses constantly generate data, including website visitors, orders, advertising costs, and customer behavior. A good dashboard helps track results across all channels in real-time.
Examples of information that should be included include:
- Number of website visitors
- Conversion Rate
- Average Order Value
- Daily income
- Number of orders
- Cart Abandonment Rate
- ROAS (Return on Ad Spend)
- CAC (Customer Acquisition Cost)
- Sales from the Marketplace
- Sales from social commerce
All this data helps the marketing team adjust campaigns immediately if they find that advertising performance has decreased or if certain products are more popular than expected.
3. Dashboard for factories and manufacturing sectors. Industrial plants need to continuously monitor production data in order to control costs and maintain quality standards.
Popular dashboards include:
- Production quantity per day
- OEE (Overall Equipment Effectiveness)
- Machine Downtime
- Defect Rate
- Yield Rate
- Production Cost
- Production plan
- Raw material inventory
Usage Dashboard development services This allows factory management to be immediately aware of problems and plan production efficiently, reducing losses in the production process.
4. Sales Dashboard The sales department is another division that relies on data to continuously monitor performance.
Suitable dashboards include:
- Sales Pipeline
- Opportunity Tracking
- Forecast Sales
- Conversion Rate
- Lead Source
- Individual sales
- Sales by area
- Sales closing period
This data helps sales managers evaluate team performance, analyze sales opportunities, and plan their work effectively.
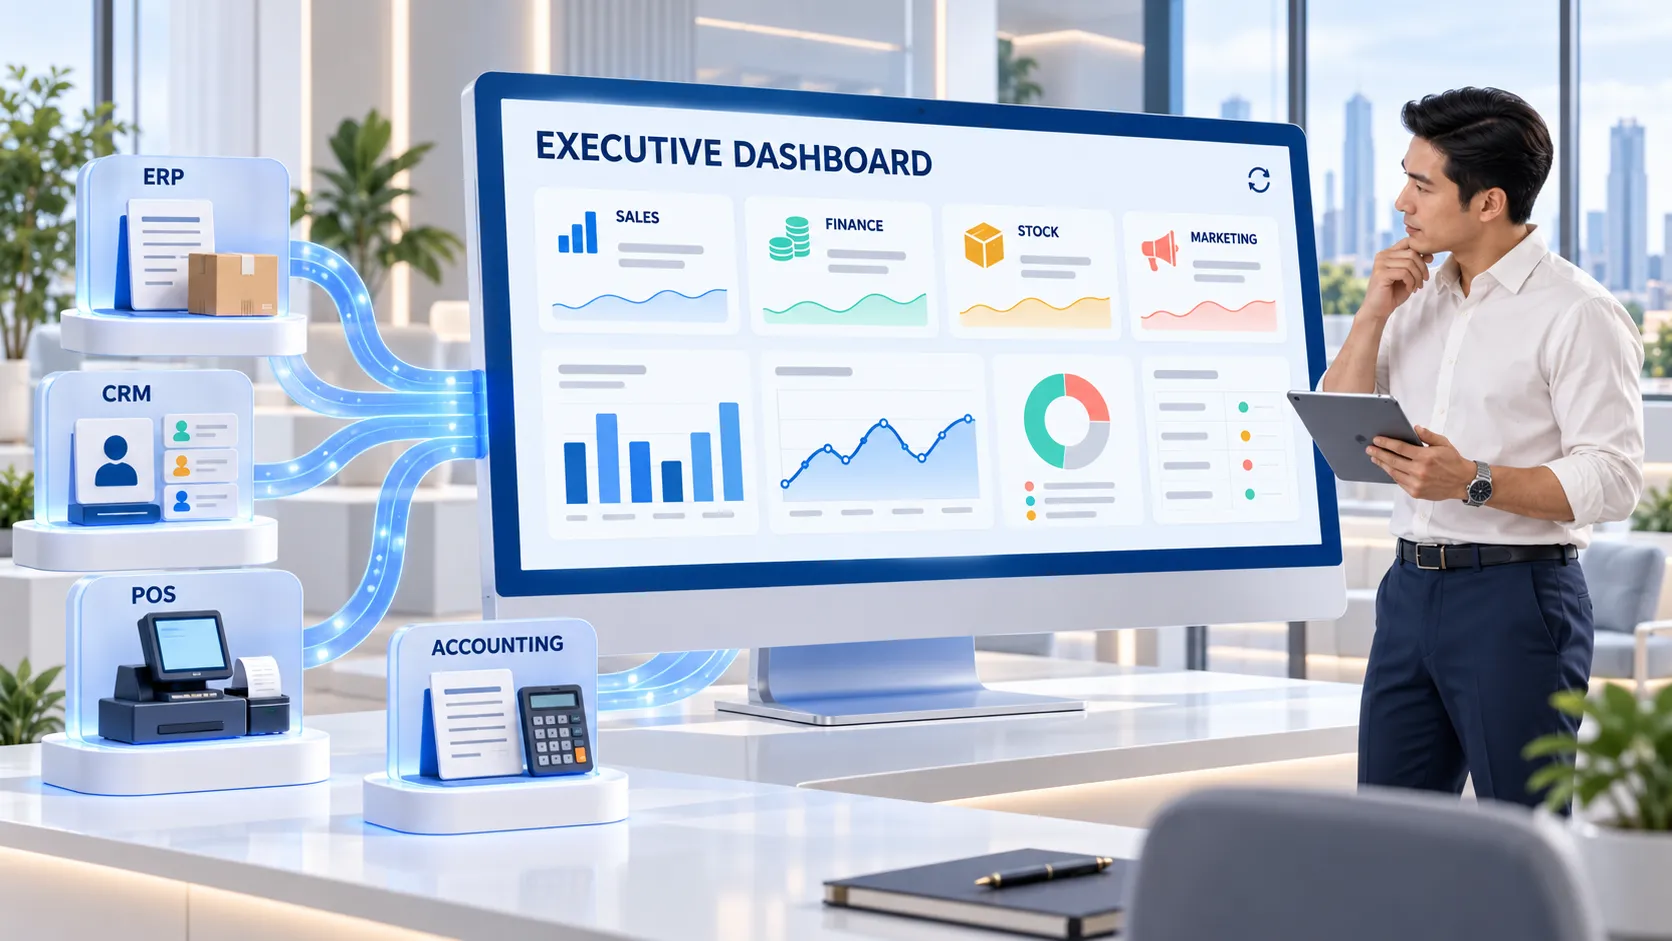
5. Executive Dashboard It's one of the most popular dashboards because it consolidates important information from the entire organization onto a single screen.
Examples of KPIs that management wants to see include:
- Revenue
- Net Profit
- Gross Margin
- Cash Flow
- Customer Growth
- Employee Productivity
- Sales Performance
- Marketing Performance
- Financial Performance
- Project Status
Having an executive dashboard helps reduce meeting time, eliminates redundant reporting, and ensures that decisions are made based on accurate data.
The right dashboard development service for your organization
dashboard service providers , but not every company can design a system that aligns with each organization's workflow. Therefore, before making a decision, Dashboard development services The following factors should be considered.
1. Experienced in developing custom dashboards for organizations. Each business has different operating procedures and key performance indicators ( KPIs). Therefore, a dashboard shouldn't just be a ready-made template , but should be able to be designed and customized to meet the specific needs of the organization.
2. Supports data connectivity from multiple systems. Service providers should be skilled in connecting data from...
- ERP
- CRM
- HRM
- POS
- Accounting
- Cloud Database
- REST API
- Google Analytics 4
- Power BI
- Tableau
- Microsoft SQL
- MySQL
So that all the information can be shared efficiently.
3. Design a user-friendly dashboard . A good dashboard isn't one with a lot of graphs, but rather one that displays only the essential data, is easy to understand, and is practical to use. Proper UX/UI design allows users of all levels to access information without needing technical knowledge.
4. Provide consultation and post-development support. Businesses are constantly changing, and KPIs and reporting formats may need to be adjusted to align with new goals. Therefore, service providers should have a team capable of providing long-term consultation, system improvements, and further development.
Frequently Asked Questions ( FAQ)
1. What is Dashboard development service ?
Dashboard development services This service involves designing and developing systems to collect data from various sources, such as ERP, CRM, HRM, accounting systems, or other databases, and display it in the form of graphs, tables, and KPIs. This helps management and teams monitor performance, analyze data, and make quick and accurate decisions.
2. What are the advantages of a real -time dashboard ?
Real -time dashboards allow organizations to track the latest data instantly, without waiting for reports to be generated, enabling them to respond quickly to business problems and opportunities. Examples include tracking sales, inventory, marketing campaign performance, or production status.
3. What systems can the Dashboard connect to ?
Generally Dashboard development services It can connect to various systems, such as:
- ERP
- CRM
- HRM
- Payroll
- POS
- Accounting software
- Google Analytics 4 (GA4)
- Google Ads
- Meta Ads
- LINE OA
- Cloud Database
- SQL Database
- REST API and Web Service
This depends on the data structure and technology used by the organization.
4. Should small businesses use dashboards ?
It's highly recommended because dashboards aren't just for large organizations. Small and medium-sized businesses (SMEs) can also use dashboards to view sales, track costs, analyze customer behavior, and manage data efficiently. This helps business owners make faster decisions and reduces the time spent preparing reports.
5. How long did it take to develop the dashboard system ?
The development time depends on the complexity of the project, the number of data sources, and the features required. Generally, it may take approximately... 4–12 weeks For standard systems, this may take longer, and for projects requiring connectivity across multiple systems or the development of custom enterprise dashboards , it may take even longer.
6. What factors should be considered when choosing a dashboard development service provider ?
The following factors should be considered.
- Experienced in dashboard development.
- Custom designs are possible .
- Supports connection with multiple systems.
- We have a team for consultation and after-sales service.
- User-friendly UX/UI design.
- Supports future system expansion.
- Prioritize data security.
Summarize
In an era where data is central to business competition, accurate and rapid decision-making is crucial for sustainable organizational growth. Simply having a large amount of data may not be enough if that data cannot be analyzed and presented in an easily understandable format. Choice of use Dashboard development services Therefore, it is an investment that helps elevate the organization's data management, from collecting data from multiple systems, displaying real-time results , tracking KPIs , to conducting in-depth data analysis ( Business Intelligence) , which helps executives plan and make decisions effectively.
in addition Dashboard development services It also helps reduce report preparation steps, minimizes manual errors, increases data transparency, and enables all parties to access the same set of data ( Single Source of Truth) , resulting in more efficient collaboration within the organization. However, developing a truly business-oriented dashboard requires experts who understand technology, infrastructure, data, and organizational processes to ensure the system's long-term scalability and future upgradeability.
If your organization is looking for a service provider in... Dashboard development services We can design customized systems for your business, connecting data from ERP, CRM, HRM, accounting systems, websites, or online marketing platforms, and provide consultation from needs analysis to post-installation support. Webpark Company Limited We are ready to be your digital solution partner , helping your business become a data -driven organization and build a sustainable competitive advantage in the digital age.
Contact us
Webpark Co. , Ltd.
525/89 Soi Ladprao 126 ( Karnporn ), Phlapphal , Wangthonglang , Bangkok 10310
Email: oraphan@webpark.co.th
Tel: 095 539 2666
Let us be your technology partner to help drive your business towards efficient management and support stable and sustainable growth in the digital age.